Nowadays, many enterprises encounter a contradiction when deploying security monitoring plans: they must not only collect terminal data in all aspects, but also prevent the system from being too complicated, which will make management difficult. The open source security platform provides a compromise plan that achieves centralized supervision by installing a lightweight agent on the terminal.
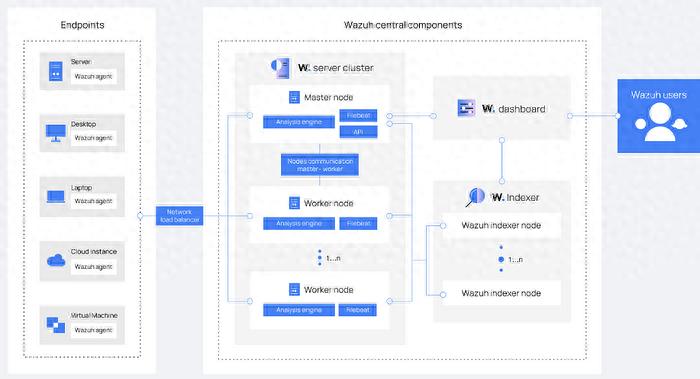
Deployment and data collection

During actual operation, the first step is to install an agent program on each server or computer that needs to be monitored. For example, for common Linux servers, users usually install the agent directly through the software package manager. After the installation is completed, the agent will start operating immediately. It continuously scans key log files in the system, such as authentication logs that record user login behavior, and other logs that record system operating status. These data are the basis for subsequent security analysis.
curl -sO https://packages.wazuh.com/4.3/wazuh-install.sh && sudo bash ./wazuh-install.sh -a
The resource usage of an optimized agent program is that it usually only consumes a small amount of memory and CPU. This design ensures that it will not affect the normal business operation of the monitored server. The agent will perform preliminary formatting on the collected log data, and then send it to the central management server through an encrypted channel. This process is automatic and ongoing.
central server processing
After the server with central management function receives the data streams from different agents, it will start a series of analysis processes. At the beginning, this server will perform operations on decoding and normalizing data, integrating logs with different formats into a standard structure for presentation. Immediately afterwards, the core analysis engine began to enter working status. The engine is built with thousands of predefined detection rules.
A variety of threat scenarios are covered by these rules, such as brute force attacks, abnormal login behavior, suspicious file changes, etc. Moreover, the analysis engine will call external threat intelligence data. If an IP address is marked as malicious in the intelligence database, the relevant logs will be highlighted immediately. The server will store the analysis results in a dedicated database.
Dashboards and Visualization
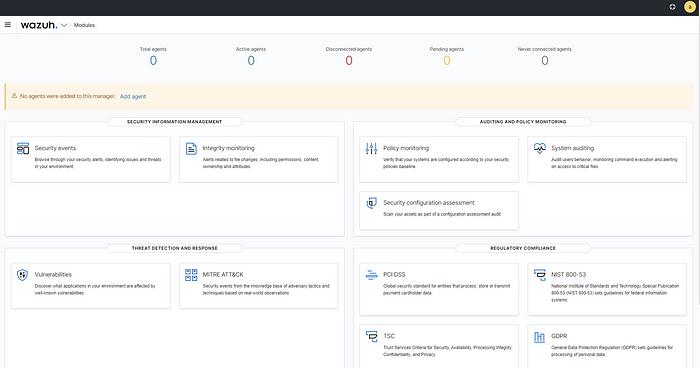
Administrators use a browser to access the visual dashboard of the management platform. The home page of the dashboard usually displays an overview of the global security status, which covers the number of active agents, statistics of recent security events, and key indicators such as threat level distribution. This information is presented in the form of charts, allowing administrators to quickly grasp the overall situation.
The platform provides multiple levels of view navigation. Administrators can click to view the detailed status of a single agent, which covers the last check time of the agent, the number of collected logs, and the recently triggered security alerts. The dashboard also integrates management functions. Users can directly add new agents here, adjust rules, or configure automatic response strategies.
Advantages of open source architecture
The core advantage of adopting an open source architecture is its customizability. The enterprise security team can directly view and modify the system source code. For example, if there are special compliance requirements in a certain industry, the team can add the extraction function of specific fields in the log collection part. This kind of flexibility is not easily provided by closed-source commercial software.
The open source model brings community dynamics that drive continuous improvement. Globally, security researchers and engineers submit code together for the purpose of fixing vulnerabilities and adding new features. When users encounter specific problems, there are often two ways to solve them. One is to find solutions in community forums, and the other is to obtain direct assistance from the forums. Thanks to the collaborative ecosystem this situation creates, software can quickly adapt to situations where new threats exist.
Initial configuration and verification
After the server-side installation is completed, users use the HTTPS protocol to access the management interface. When logging in for the first time, they need to use the default account and password generated during the installation process. Due to security considerations, the system will forcefully require an immediate password change. After successful login, the interface will appear in an initialized state.
At this time, there is still a lack of agents to connect. When the first agent is installed, it is followed by a successful connection to the management server. In this case, the data list recorded about the agents in the dashboard will be kept up-to-date at any time. For the administrator, the administrator can see a series of information related to the newly registered agent, such as host name, IP address, operating system type, and even agent version. Such a situation fully confirms that the entire data link has successfully achieved an unimpeded state.
Security incident analysis examples
When the server is monitoring as an agent, if a user login event occurs, the agent will capture such a record from the system's log file used to give authentication status. For example, if there is a successful SSH login situation, in the Ubuntu system environment, this situation will be recorded in the auth.log file under the /var/log/ path. The agent reads this log, adds a timestamp and information about the host, and sends it to the central server.
On the search interface of the management platform, administrators can query all login events within a specific time period. The results of the query will show the source IP address of each login, the account name used, the login time, and even whether it was successful. If it is discovered that a certain IP has attempted to log in to a large number of different accounts in a short period of time, the system will automatically generate a medium-level alert in accordance with the rules.
Active defense configuration
sudo apt install nginx
In addition to monitoring, the platform can also link with other security devices to implement active interception. For example, when a certain IP address is detected for malicious scanning, it can automatically trigger the firewall rules to activate and temporarily ban. The administrator must first configure tools such as Nginx or iptables on the server as executors.
The actual operation covers writing proactive response scripts and configuring trigger conditions in the management platform. For example, when an alarm is triggered that causes more than 10 failed logins from the same IP within 1 minute, a ban script must be executed. This script will add a temporary rule to the firewall to block that IP address for 300 seconds. After the ban is completed, the rules will be automatically lifted to prevent accidental harm to normal users.
Effect verification and optimization
After completing the configuration, it is time to carry out actual testing. Use a test machine to simulate attack behavior, such as using automated tools to try to crack passwords. The management platform must be able to present these failed login attempts in real time and generate corresponding alerts. At the same time, after the attack continues for a period of time, the test machine can no longer connect to the target server.
    syslog
  /var/log/nginx/access.log
Administrators should regularly check the execution logs of active responses to confirm whether the interception action is operating as expected. It may be necessary to adjust the trigger threshold, such as adjusting 10 failures to 5, in order to increase sensitivity. Rule optimization is a continuous process that must be carried out in conjunction with the actual network environment and threat changes.
During your actual work, have you ever encountered a situation where the security monitoring system had too many false positives or missed key events? So in this case, how do you adjust the rules to balance the detection effect and the operation and maintenance burden? Welcome to share your experience in the comment area. If you think this article is helpful to you, please give it a like and support.
sudo wget https://raw.githubusercontent.com/firehol/blocklist-ipsets/master/alienvault_reputation.ipset -O /var/ossec/etc/lists/alienvault_reputation.ipset