For Android developers, debugging work often relies on scattered tools, which is inefficient and complicated. The same is true for reverse work. A toolbox equipped with core functions such as decompilation and layout viewing can greatly improve the efficiency of development and troubleshooting.

Decompilation and resource viewing
For applications running on Android 8.0 and higher, the code and resource files contained within them can be directly viewed. This function bypasses complicated command line operations and directly presents the decompiled Java code, XML layout, and image resources in the graphical interface. It not only supports code highlighting, but also can quickly locate the specific files corresponding to the resource IDs, making it more intuitive and efficient to analyze competing products or learn third-party application implementations.
In-depth analysis of interface layout
Checking the actual interface structure of other applications is the focus of UI debugging. This tool can dynamically present a complete view tree of the foreground application, covering the category, size, spacing and ID of each control. When the screen is clicked, the tool will list the details of all overlapping controls under the coordinate point and their nested relationships. This tool will directly help deal with thorny issues such as interface coverage and touch event conflicts.
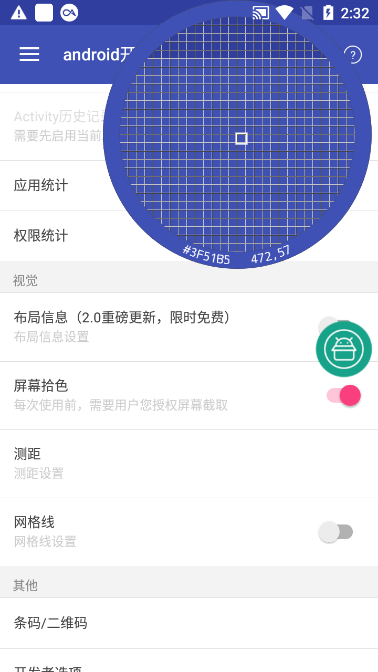
Live screen color picking
When it comes to designing or restoring UI, accurately obtaining color values is particularly critical. The screen color picking function can display the exact coordinates of the fingertip at any time and give the corresponding RGB hexadecimal color value. Developers can quickly copy these color data and put them directly into their own development environment to ensure the accuracy of visual restoration and avoid errors caused by manual comparison.
Application information and data extraction
The tool can quickly display the package name and current active class name of any running application. More importantly, it has powerful data export capabilities. It can extract the APK installation package of any installed application on the phone and its internal native library, which is the SO file. This is convenient for analyzing application architecture, studying third-party SDKs, or backing up applications.
Installed application details statistics
This function conducts an in-depth scan of all applications on the phone and provides statistics. It can not only list the basic information of the application such as version and SDK, but also display the four major components of its application in detail, as well as the applied permission list, as well as the signature algorithm and certificate. What is particularly worth mentioning is that it can identify whether the application is reinforced by mainstream platforms such as Tencent and 360, and whether it is developed using cross-platform frameworks such as React Native.
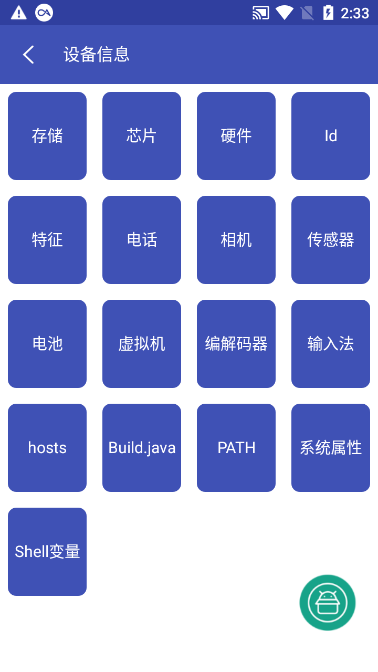
System and device information overview
In addition to application layer information, the tool also integrates a comprehensive device status report. What is a device status report? It covers current Wi-Fi and mobile network connection details, including various hardware sensor data, battery health, storage space usage, and even chip models and system build information. These real-time data are of great reference value for debugging device compatibility issues and performance optimization.
After reading this article, during the development process, have you ever been troubled by not being able to find a fully functional debugging tool? Welcome to share your experience in the comment area, or recommend other useful tools. If you find this article helpful, please like it to support it!